Chapter 5 Feature Selection
Now that we created a boat load of features, how do we decide which ones we want to use? As typical, there are many ways of performing feature selection. Here we will perform just one.
Based on the data frame we created in d and the transformation recipe we made we are going to do some initital analysis on which features we want to keep or drop. The xgboost package provides a function, xgb.importance() that gives a summary of how important each feature was in a model estimated by xgb.train(). We will use this to help guide our selection of features to carry forward. However, we want to make sure that we don’t mistakenly remove a feature that is actually important, so instead of running the xgb.importance() function just once on all of our traning data, we will use v fold cross validation to create mutliple sub samples and run the xgb.importance() function for each one.
5.1 Generate Importance Helper Function
library(broom)
library(purrr)
library(xgboost)

importance_results <- function(splits) {

  x <- bake(rec_prepped, newdata = analysis(splits))
  y <- x$log_error

  d <- model.matrix(log_error ~., data = x)
  d <- xgb.DMatrix(d, label = y)

  mdl <- xgb.train(data = d, label = y, nrounds = 1000, nthread = 4)
  print(summary(mdl))

  mdl_importance <- as.data.frame(xgb.importance(model = mdl))

  mdl_importance
}
5.2 V-Fold Cross Validation Resampling
Create the resampling, run the models and summarize the results
library(rsample)

resamples <- vfold_cv(d, v = 10, repeats = 5)

resamples$results <- map(resamples$splits,
                         importance_results)


importance_df <- bind_rows(resamples$results)

feature_avg <- importance_df %>%
  group_by(Feature) %>%
  summarise(
    mean = mean(Gain),
    sd = sd(Gain),
    n = n()
    )
5.3 Inspect Importance Results
feature_avg %>%
  ggplot(aes(x = forcats::fct_reorder(Feature, mean), y = mean)) +
  geom_hline(aes(yintercept = 0.001), colour = "red", size = 1, alpha = 0.5) +
  geom_point(size = 1) +
  geom_errorbar(aes(ymin = mean - sd * 2, ymax = mean + sd * 2)) +
  coord_flip() +
  theme_bw() +
  theme(
    axis.text=element_text(size = 6)
    ) +
  labs(
    x = "Feature",
    y = "Mean Gain"
  )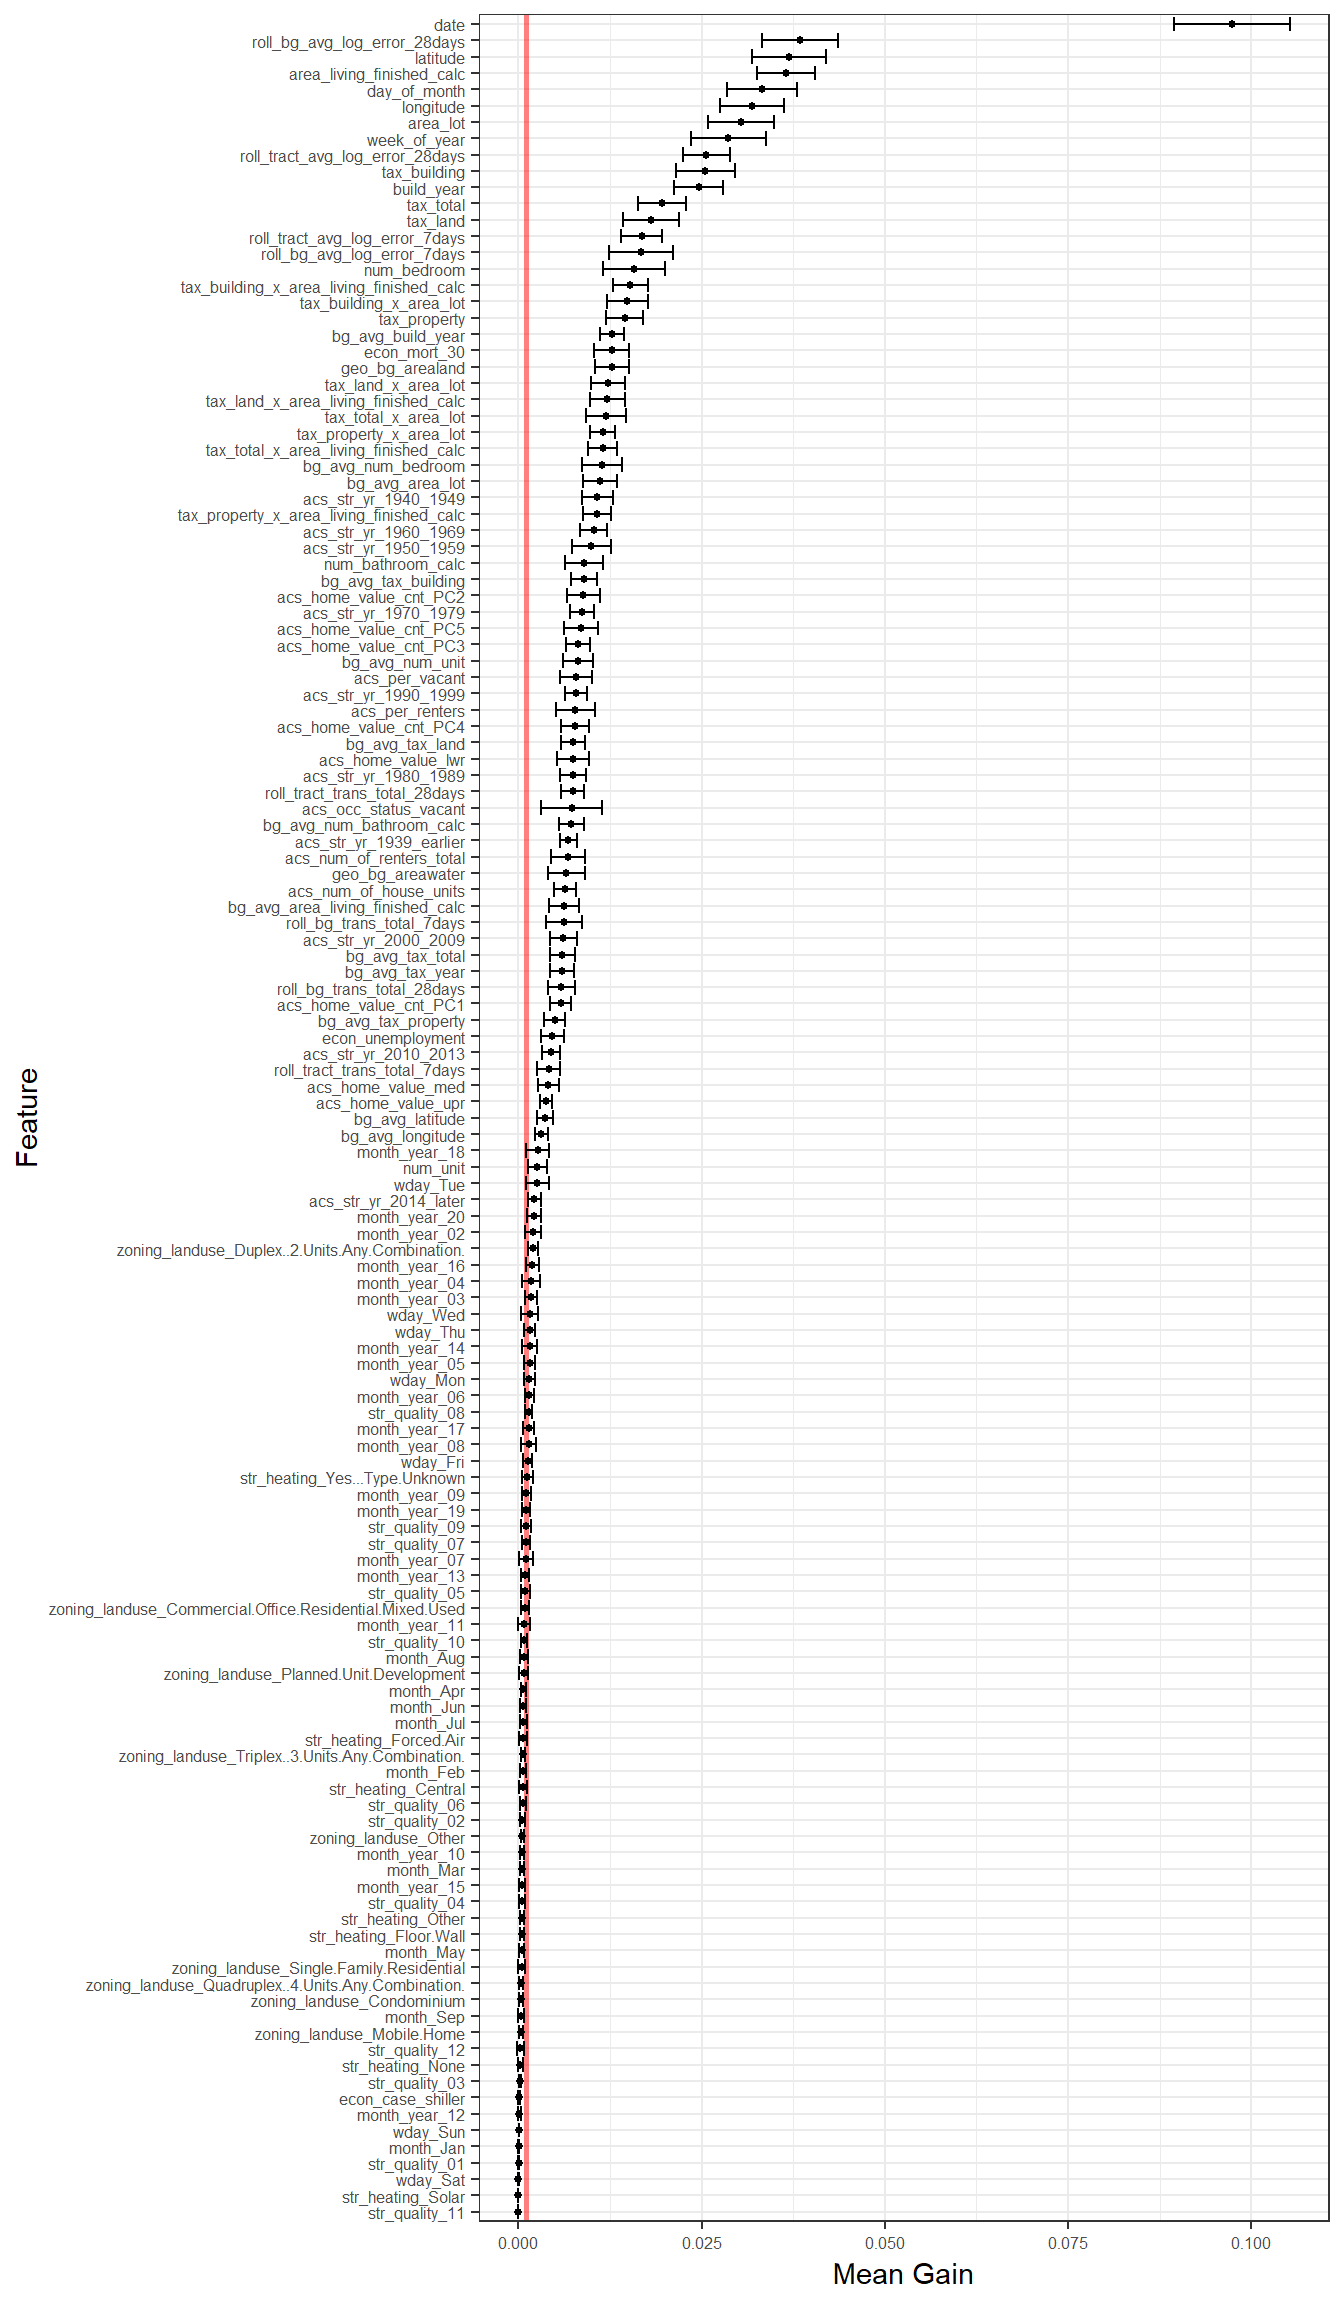
Figure 5.1: Mean Feature Importance Based on Cross Validation Using Basic XGBoost Model
To reduce the complexity and computation time our of modeling, we are going to remove the feature that consistantly did not provide much value by cutting off the number of features we’ll use at a mean gain at 0.001 (red line).
features_to_use <- feature_avg %>%
  filter(mean >= 0.001) %>%
  .$Feature